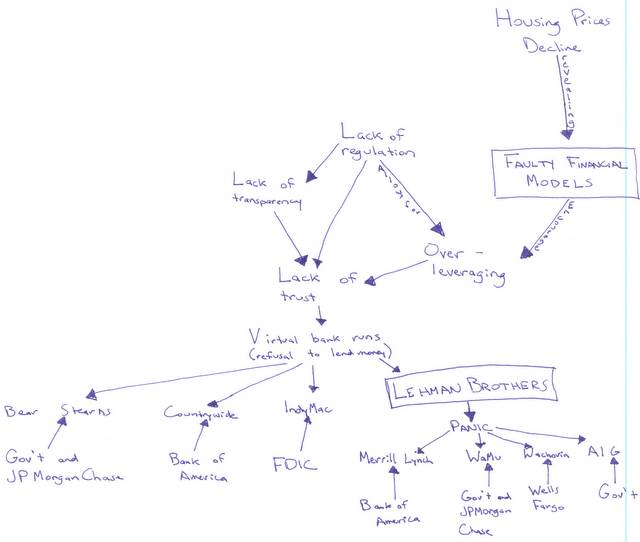
A Chart of the Lehman Mess
By Joe Campbell
October 22nd, 2008
I've been trying to figure out how to explain my understanding of the liquidity crisis that was the latest and most panic-stricken phase of the ongoing financial crisis.
I've created a series of charts - trying to put all the different factors in perspective.
They are all basically drafts at this point - but let me know what you think, if you have any suggestions.
(For those who are going to say the government - and especially Fannie Mae and Freddie Mac - played a role in causing this mess aside from the lack of regulation, and failing to act to prevent Lehman Brothers from collapsing - the government is given a greater role in the section that is expanded on in the "Housing Prices decline" chart that I haven't posted yet. If you see a greater government role in the events and factors here - as some who read this previous piece of mine did - than let me know where - because I haven't really seen any specific explanations that seemed convincing.)
Tags: Lehman Brothers